Ethiopian Airlines: taking the wildebeest
by the horn
June 2018

Ethiopian Airlines is the largest, most profitable and commercially oriented airline in sub-Saharan Africa. It set out on a mission to offset a decline in the African carriers' share of traffic to and from the continent and has set up a successful full service network hub operation in Addis Ababa, in the Horn of Africa. Can it successfully compete against the airlines of the former colonial powers and the insurgence of the Superconnectors?
The national flag carrier of Ethiopia was established in 1945 (with help of TWA). From the start it has operated on a commercial basis — even during the Marxist-Communist era of the Derg regime in Ethiopia of the 1980s — and has consistently been one of the more profitable carriers in sub-Saharan Africa.
But land-locked Ethiopia is one of the poorest nations in the world, with an average $872 per capita GDP ($2,160 in PPP), while being the second largest nation in Africa with a population of 104m (behind Nigeria at 180m). It has one of the fastest growing economies in the world (albeit from a low base) with an average real GDP growth of 10% in the past eight years; and the IMF forecasts an average real growth of 8%pa over the next five years.
At the same time its national flag carrier has built the largest flight training school, aircraft maintenance operation, cargo facility, and inflight catering operation in sub-Saharan Africa; it now operates to 21 domestic destinations, 62 regionally, 35 intercontinentally and carries over 9m passengers a year.
Its revenues have grown from $1bn in 2008 to $2.7bn in 2017 (FY ending June). Capacity in terms of ASK and traffic in terms of the number of passengers has grown by an average annual 15% over the period. And yet it has remained profitable throughout the period (see chart) achieving peak operating margins of 14% and pretax margins of 11% in the year ended June 2016.
As a Government-owned operation it is not necessarily required to make public its full annual accounts, but has tended to do so. There may be a question of disquiet that the full accounts for the year to end June 2017 are still not available, although in a press release it stated that it achieved net profits of $233m in that financial year.
This is in stark contrast to the next two largest operators in the region — South African Airways and Kenya Airways.
SAA lost R13bn (US$1bn) in the five years to end March 2017 at the operating level with static capacity and demand growth over the period.
Kenyan managed to lose /=72.5bn ($700m) over the same period with a similar low rate of growth in capacity and demand: and it went through a debt-for-equity swap at the end of last year to attempt to remain solvent.
One of the main reasons behind Ethiopian’s success, maintains the company’s long-standing CEO Tewolde GebreMariam, is a concentration on efficiency and tight cost control. Employees do not get paid unless they electronically clock in and out each day; the airline does not give free flights to civil servants or politicians; the back-office is paper-free. These are not necessarily usual practices in Africa.
It also helps to have relatively low employment costs (for all except the flight crew). While maintaining a full-service two class operation (the premium class, with full lie-flat seats on long haul, imaginatively branded “Cloud-Nine”), Ethiopian seems to have a substantial unit cost advantage against its main competitors (see chart).
Ethiopian has grand plans. Under its “Vision 2025” strategic plan it has stated that it aims to build its business to increase its fleet by 50% from the current 100 units to 150 by 2025 and increase revenues to $10bn a year. “The centre of confidence for us in Vision 2025”, explains GebreMariam, "was the trade lane between China, Africa and Brazil... which is the fastest-growing trade lane in the world."
It is not just relying on its hub in Addis Adaba. Ethiopian took a 40% stake in and a management contract to run Togo-based ASKY Airlines in West Africa — a multinational replacement for the defunct Air Afrique — operating four 737s and four Dash 8s. It has a 49% stake in Lilongwe-based Malawi Airlines (operating one 737 and one Dash 8). It recently signed an agreement with the Zambian government to take a 45% stake in a re-launch of a national flag carrier Zambia Airways and develop Lusaka as another regional hub. It is planning to start a new airline in Mozambique, initially for domestic services.
It appears to want to create a multi-hub system in the sub-continent through associate investments and management contracts, and Tewolde GebreMariam says that he has also been in discussion with Chad (an MoU signed earlier this year), Djibouti, Equatorial Guinea and Guinea. Bluntly, GebreMariam points out: “Going forward, it will be difficult for us to compete with only one hub in Addis Ababa.”
It has not been particularly successful in reversing the decline in the presence of African airlines in Intercontinental access to sub-Saharan Africa, but has least stabilised the decline through its own growth: airlines based in the region in 2018 seem set to provide the same 28% proportion of intercontinental capacity as they did in 2010 (see chart).
However, in the past decade there has been substantial growth of services into the region from the Super-connectors in the Middle East and Turkey (primarily Emirates and THY). Since 2010 the Superconnectors' share of capacity has grown from 20% to 32% — reflecting a compound annual growth of 12% — mostly at the expense of airlines of the former Colonial powers. The European network carriers have seen their share of capacity fall from 46% to 37% over this period (excluding the domestic services between France and its Indian Ocean dominions) — an annual average growth of 2%.
SAATM
The African air transport market only accounts for 2% of the world’s air traffic but has huge potential.
The continent has a population of over 1.2bn people, some fast growing economies, huge mineral wealth, dramatic levels of inward investment (particularly from China), and poor ground transport infrastructure. And yet it has some of the most restrictive cross-border aviation bilateral agreements, highest costs of aviation fuel, taxes and airport fees in the world.
In January this year, after first being promulgated 30 years ago, the 1998 Yamoussoukro declaration was formally adopted by the African Union to implement the Single African Air Transport Market (SAATM). Twenty-three of the 55 AU nations signed up to the deal. IATA remarked that “the SAATM has the potential for remarkable transformation that will build prosperity while connecting the African continent”.
Hitherto, there have been very limited air traffic flows within Africa, except domestically. South Africa accounts for half of the 40m domestic seats in sub-Saharan Africa with Cape Town--Jo’burg the densest route (itself the 26th busiest city-pair in the world) followed by Durban--Jo’burg; domestic operations in the next biggest markets of Nigeria (Abuja--Lagos the third largest route in the area), Kenya, Ethiopia and Tanzania account for another third. Domestic routes have grown by an annual average 2% a year since 2010.
The SAATM provides the potential for liberalisation of fares, schedules and access within the region. No doubt in time this will generate growth; but to get that growth passengers need a reason to travel, and there seem little in the way of natural traffic flows within the region. There are only a handful of route pairs that currently support more than a modest level of capacity or frequency: the largest routes (having more than 0.5m seats a year) being Jo’burg-Harare; Nairobi to Entebbe, Addis Adaba and Jo’burg; Jo’burg-Windhoek; and Harare-Lusaka.
Sub-Saharan cross-border capacity has grown from 21m to 29m seats since 2010 — an annual average growth of 4%. Half of this growth has been generated by Ethiopian itself in opening and expanding services into its hub in Addis Adaba.
(The one recent attempt to establish an intra-regional LCC seems to be on the brink of failing. Fastjet (see Aviation Strategy, Sept 2014) is currently going through an emergency $10m capital raising exercise to give it enough cash to last through the rest of the year — in its last financial year to end Dec 2017 it lost $25m at the operating level on revenues of only $45m, although that was better than the prior year operating loss of $66m on revenues of $69m.)
Inter-continental battle ground
And yet the largest existing traffic flows are intercontinental — some 45m return seats in 2018 up from 30m in 2010 — and have been growing at 5% a year. Historically these routes primarily served connections to former colonial powers in Europe, and for onward services through the main hubs there: and for the European carriers, these routes have tended to be highly profitable, partly because of the poor local competition.
A decade ago the densest routes included London to Johannesburg, Lagos, Nairobi and Capetown, and Lisbon to Luanda. But in the past ten years there has been a shift in focus towards the East; and as the Super-connectors have grown they have specifically been able to target China’s growing interest in Africa.
Emirates is the largest operator on intercontinental services out of Africa (see chart), and Dubai now features in seven of the top ten routes. It (and short haul sister company flydubai) operate to 23 destinations in the region from Dubai (up from 14 in 2010), and is probably Ethiopian’s biggest competitor.
The other Middle East super-connectors have also increased presence with Qatar serving 14 destinations (up from 4 in 2010) and Etihad present in 6. However, Etihad is currently reviewing its whole operations and Qatar, prohibited from Saudi airspace, cannot operate competitively.
Of more concern may be the expansion of THY, currently serving 30 destinations in the region from İstanbul (up from 7 eight years ago). The amount of capacity it has put into the individual markets is relatively small, using narrowbody equipment, but it has expanded its footprint strongly.
However, Ethiopian has a strong advantage. It serves 49 destinations in the region outside Ethiopia (up from 40 in 2010) and can access relatively short haul and low density routes to feed its hub in Addis Adaba.
Capacity constraints
But Ethiopian’s base at Addis Adaba’s Bole International Airport has become constrained by the company’s high growth. A new terminal facility is due to open shortly to boost annual capacity to 22mppa.
The government meanwhile has plans to build a new hub airport — 4 runways and ultimate capacity of over 80mppa at a cost of c$2.5bn. It is expected that a site will be chosen before the end of this year. Among the criteria for the choice are that it should be close to the city but at a lower altitude — at an elevation of 2,300m above sea-level the current airport is classified as “hot and high” which significantly constrains Ethiopian’s operation of long haul routes (the US routes it operates direct have tech refuelling stops in Dublin, see map).
Opening doors
Ethiopia has not been known as the most open of countries. But in April this year a youthful 41-year old Abiy Ahmed Ali was elected Chairman of the country’s ruling coalition, the Ethiopian Peoples' Revolutionary Democratic Front (EPRD), and thereby appointed as the country’s Prime Minister.
Quite quickly he has embarked on a series of much-needed reforms. He has signalled the end to the long running border dispute with Eritrea since the end of hostilities in the Ethiopian-Eritrean war in 2000. In June the government announced a plan to pursue the large-scale privatisation of state-owned enterprises and open certain sectors to competition — including telecoms and aviation. Well, privatisation may be too big a word — the state will retain a majority interest — but it will be open to selling a minority stake in Ethiopian Airlines to local or foreign investors. While being an ideological shift in the EPRD’s long held views of state-control it could be viewed as a pragmatic way to boost much-needed foreign reserves. It has even been suggested that the country will open a local stock exchange.
Ethiopian Airlines aims to be the pan-African passenger and cargo network that connects the continent. It has grown to its current position profitably. As GebreMariam has said: "Growth in the industry is often unprofitable, but being government-owned, we have no other way of raising money — we can’t go to the stock exchange — so we have to make sure it is profitable." The challenge will be to continue to do so and efficiently manage the development of its multi-hub network of associate airlines.
| In Service | On Order | |
|---|---|---|
| 737-700 | 8 | |
| 737-800 | 16 | |
| 737 MAX8 | 30 | |
| 767-300 | 6 | |
| 777-200 | 6 | |
| 777-300 | 4 | |
| 787-8 | 19 | |
| 787-9 | 2 | 6 |
| A350-900 | 7 | 17 |
| Q400 | 20 | 13 |
| 777F | 6 | 4 |
| 757-200F | 2 | |
| 737-800F | 2 | |
| Total | 96 | 72 |
Source: Company reports
Note: Financial year ending June
SEAT CAPACITY BY CARRIER
Source: schedules data. Excludes France-La Reunion (technically domestic).
Note: top 13 carriers account for 75% of seat capacity.
INTRA-REGIONAL CAPACITY
Source: schedules data. Notes: Top 13 carriers account for 80% of capacity. Ethiopian includes ASKY; SAA includes Mango. Includes domestic operations.
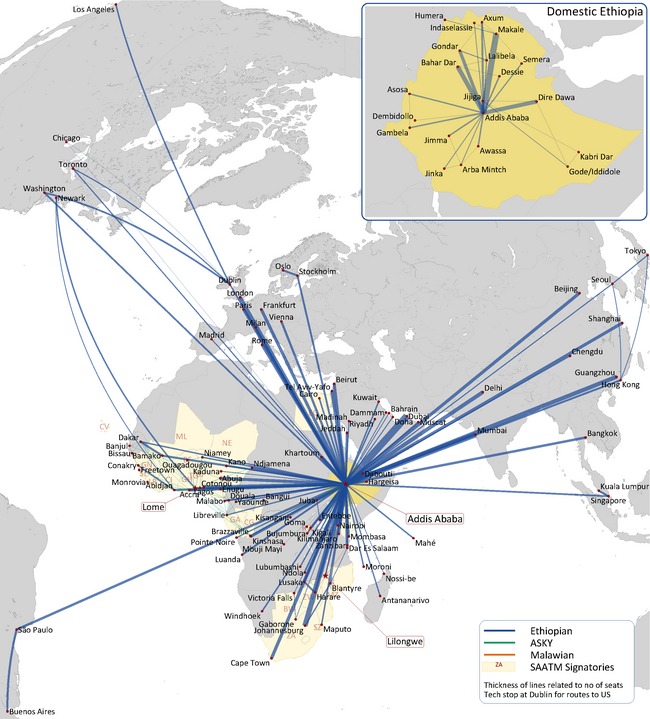
Notes: Equidistant map projection centred on Addis Adaba (great circle routes appear as straight lines)
Thickness of lines directly related to number of seats.
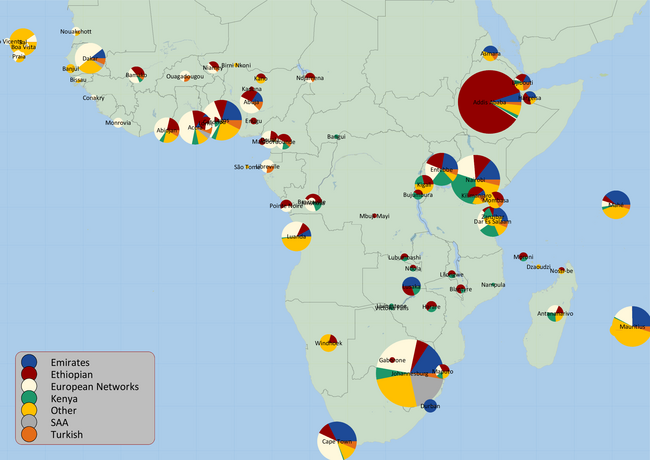
Source: schedules data. Notes: number of seats by operator. a) Ethiopian and Kenya: intra-regional services to their respective hubs in Addis Adaba and Nairobi, inter-continental services from those hubs b) Emirates, THY and Euro Network carriers (IAG, AF-KL, LHAG, TAP): intercontinental services to their hubs outside the region.