LATAM: New competitive
landscape, New business models
March 2018

After several tough years and an impressive restructuring of its fleet and order/lease commitments, LATAM Airlines Group is seeing profits bounce back as Brazil’s economy recovers and air travel demand growth accelerates throughout Latin America.
LATAM is looking to grow its Brazil domestic ASKs for the first time since 2011. 2018 could also be an interesting year in international markets because of the likely implementation of the Brazil-US open skies regime, to be followed by the development of LATAM’s planned JBAs (Joint Business Agreements) with American and IAG from early 2019.
But will LATAM ever get back to the double-digit operating margins of the past, given intensified competition from LCCs. Is LATAM’s new lower-cost business model in Chile, Peru, Colombia, Argentina, Brazil and Ecuador the right strategy to deal with the upstarts? Is there a real risk of losing premium market share?
Impressive restructuring
LATAM Airlines Group was created when Chile’s LAN completed its cross-border acquisition of Brazil’s TAM in June 2012. Unluckily, the closing of the merger coincided with a dramatic slowing of economic and air traffic growth in Brazil, a weakening of many Latin American currencies and the onset of a multi-year cargo slump.
In 2014 Brazil slid into its worst recession in decades and the region’s economic problems worsened. Airlines saw a further weakening of demand, plummeting unit revenues and yields, currency devaluations and massive foreign exchange losses. LATAM was hit hard by the slump in cargo, historically one of LAN’s key strengths.
It was ironic that the very reason LAN wanted TAM — the huge Brazilian market — turned into one of its biggest problems. The merged entity had heavy exposure to Brazil’s domestic market: 36.5% of its total ASKs in 2012.
LAN had been consistently profitable up to and including 2011, earning double-digit operating margins and solid net profits since the mid-2000s. But the merger and Latin America’s economic woes led to LATAM incurring net losses totalling $1.1bn in 2012-2015.
However, LATAM continued to report operating profits in the low-single digits even in the toughest years. 2016 saw a slightly higher 6% operating margin and, as the currencies had stabilised, a modest net profit. The airline’s management had taken a number of effective actions to deal with the challenges.
First, LATAM implemented what may have been the sharpest cost reductions of recent times among global carriers. It even achieved a 20% headcount reduction in the three years to December 2017.
Second, LATAM responded to Brazil’s crisis by implementing the sharpest capacity cuts in the industry. TAM’s domestic ASKs contracted by 25% between 2012 and 2017, reducing LATAM’s exposure to Brazil’s domestic market by ten points to 26.5% of its total ASKs.
Third, LATAM downsized its fleet quite drastically in the past couple of years and eliminated as much as $2.6bn from previously planned fleet spending in 2016-2017.
Fourth, LATAM found new ways to maintain liquidity. In December 2016 it received a $600m cash injection by selling a 10% equity stake to oneworld partner Qatar Airways, which boosted its cash position from 15% to well over 20% of LTM revenues. LATAM was also able to pass two A350s to its partner on 6-12 month leases.
LATAM’s operating revenues fell from $13.3bn in 2013 to $9.5bn in 2016 — a 28% contraction. Although revenues rose by 6.7% to $10.3bn last year, they were still 23% below the 2013 level.
Profit recovery at last
2017 was a recovery year for LATAM as Latin America’s economies began to turn around, Brazil officially emerged from recession (Q2), currencies stabilised and industry capacity discipline prevailed in key markets. LATAM’s operating profit improved by 26% and accounted for 7% of revenues, while net profit more than doubled to $155.3m. Those were respectable results in a year when the LATAM’s average unhedged fuel price increased by 17.5% and its operating fleet shrank by 22 units.
The main themes were, first, a robust unit revenue recovery across all the business units. System RASK rose by 5.3% and system capacity by 2.3%. All the regions had load factors in the mid-80s.
Second, the international segment, which accounts for just over half of LATAM’s total passenger revenue, became the new high-flyer. This segment saw a strong pricing environment in Q4, with a recovery in international travel out of Brazil, especially to the US and Europe.
Third, the cargo segment improved, which is important for LATAM because cargo still accounts for 12.2% of its total revenue and the fleet still includes 10 freighters. Cargo unit revenues rose by 13.1% in Q4. The management noted that for the first time since 2011, cargo markets were “showing signs of equilibrium between exports and imports markets, allowing us to maximise our network profitability”.
Fourth, costs remained under control. Despite substantial aircraft redelivery expenses, LATAM’s ex-fuel CASK rose by only 1.6% in Q4.
Last year LATAM’s focus shifted from restructuring to implementing strategic initiatives. The main one was a new lower-cost business model for LATAM’s six domestic markets (discussed below).
2017 also saw a corporate reorganisation. In line with global airline industry trends, LATAM introduced a “simpler, more efficient and functional” senior management structure. The group now focuses on four main areas that form the basis of the business strategy — customers, revenue, operations/fleet and finance — with the heads reporting directly to CEO Enrique Cueto.
New domestic business model
The new domestic business model, implemented during 2017, aims to make LATAM more competitive with ULCCs in short-haul operations, achieve sustainable margins, and stimulate demand. When announcing the plans in November 2016, management said that it was projecting 50% growth in domestic leisure passengers in South America in 2017-2020 and that the new business model would “maintain LATAM’s position as a key player in the growth of air traffic in the region”.
The aim was to “get as close as possible” to ULCC cost levels, with the target being a cost gap of 10-15%. The management felt that LATAM could compensate for such a gap with higher unit revenues, because of better connectivity and an attractive FFP.
The new model is remarkable in its scope: it covers nearly 76% of the group’s passengers, making it much larger than the lower-cost units introduced by airlines in other regions.
As well as offering fares up 20% lower than previously offered, the fare structure enables passengers to personalise their travel experience and only pay for services they require. There are four branded fares with predefined features. The options cover items such as first and second checked bags, preferred seating, same-day flight changes and different accrued FFP mileage.
LATAM Brazil has just introduced in-flight Wi-Fi on its domestic and regional narrowbody fleet and expects to complete the rollout by mid-2019. After that the offering will be gradually extended to other LATAM Group markets.
The plan was to achieve the cost reduction through lower distribution costs (increasing online sales to 80%), higher aircraft utilisation and higher load factors. There were no changes to seat configuration.
LATAM has reported positive initial results. In Q317 the uptake for the branded fares was 36%, bringing in $25m additional revenue. Separately, LATAM’s ancillary revenue per passenger rose by 28% in 2017, mainly from the sale of checked bags, preferred seats and same-day flight changes.
Some analysts feel that the lower-cost domestic model could lead to LATAM losing premium or corporate travel market share, especially in Brazil, which is a business-oriented market with no ULCCs. But LATAM executives said in mid-March that there had not been any material changes in the passenger mix in Brazil.
LATAM may avoid such effects because, even with the lower-cost model, it has sought to improve the passenger experience. For example, domestic flights now offer an innovative, free wireless entertainment system. And, thanks to the new Mercado LATAM buy-on-board service, a corporate passenger can now have a better quality meal on LATAM’s domestic flights.
But in international operations LATAM continues to focus heavily on premium traffic and improve product quality. A widebody cabin retrofit involving the 777s and 767s is planned in the next two years. LATAM was recently named “five-star global airline 2018” by Apex for its in-flight experience. It is one of only 15 airlines to receive IATA’s Fast Travel Platinum certification (think large numbers of airport self-service kiosks).
Network and JBA plans
Ultimately, though, it is LATAM’s size, formidable route network and leading FFP that will help it compete with LCCs.
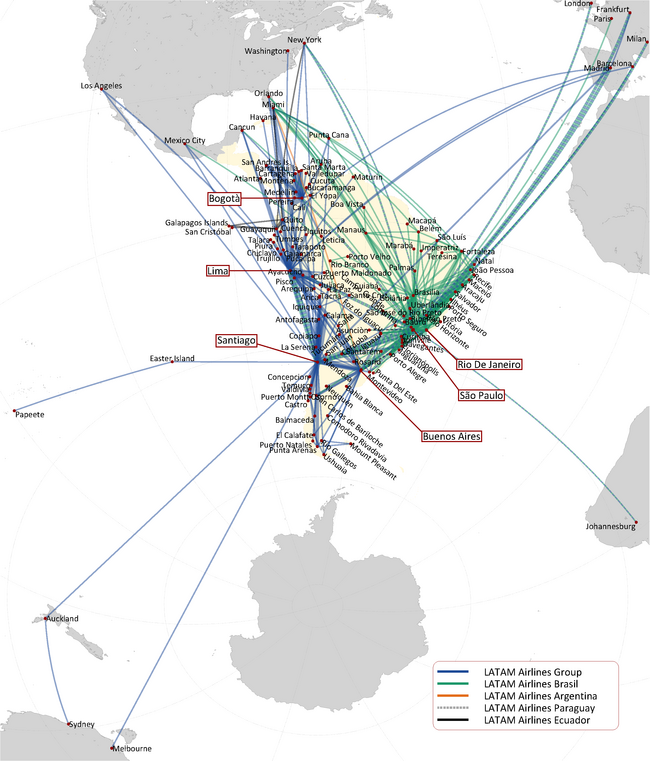
In terms of passengers (67m in 2017), LATAM is roughly twice the size of the next regional competitor (Gol). Its FFP has 30m-plus members, compared to Gol’s 13m. Its network includes around 137 destinations in 24 countries, domestic operations in six countries and three hubs that provide links to other world regions (Santiago, São Paulo/Guarulhos and Lima).
According to a recent company presentation, LATAM is the largest carrier in both Chile and Peru, with domestic market shares of 71% and 58%, respectively, in 2017. It is number two in the other four countries, with 33% of the domestic market in Brazil and 18-28% of the market in Colombia, Argentina and Ecuador.
In terms of international shares, LATAM is number one within South America, accounting for almost half (47%) of the region’s ASKs. It is number one on South America-Asia Pacific routes (45%), number two to North America/Caribbean (19%) and number three to Europe (13%).
Maintaining network leadership is important for LATAM. In 2017 it launched as many as 30 new routes, with the focus being to improve regional connectivity from hubs.
This year the focus has shifted to increasing connectivity with Europe and North America. The new city additions include Rome, Lisbon and Boston, to be served from São Paulo with convenient connections with Chile and other parts of South America.
LATAM’s focus has shifted partly because of the progress made in securing regulatory approvals for its planned JBAs with IAG and American. Brazil’s CADE approved the JBAs last year and the airlines now only need the blessing of the Chilean and US regulators.
On March 7 Brazil’s senate approved the Brazil-US open skies agreement that was originally signed in 2011. The open skies deal is a precondition for the US DOT’s approval of the LATAM-American JBA, which was signed in January 2016. The open skies deal still needs to be signed into law by President Michel Temer, but that should be a mere formality. LATAM also expects to receive the Chilean approvals this year. The EU does not require open skies for JBA approvals. (Brazil reportedly terminated its open skies talks with the EU in December because of lack of progress.)
LATAM now expects to start implementing the JBAs with its partners in early 2019. The two agreements will give it access to a global network of over 420 destinations, so the initial benefits alone could be substantial.
However, LATAM’s Brazilian competitors can be expected to follow suit with their own immunised JVs with US carriers: Gol/Delta, Azul/United and Avianca Brasil/United. There could also be more JVs with European carriers.
Interestingly, the Azul-TAP and Gol-Air France-KLM partnerships have already had some negative impact on LATAM’s network plans. In December LATAM suspended its hub project in Brazil’s Northeast, reportedly because it felt that a hub there was no longer viable following Gol’s decision to develop a new joint hub with Air France-KLM in Fortaleza and Azul’s announcement that it would strengthen its Recife hub. The Gol hub will kick off in May when KLM and Air France’s Joon start flying to Fortaleza from Amsterdam and Paris.
Balance sheet repair
As a result of the earlier restructuring efforts, in 2017 LATAM had the lowest fleet obligations in its history. The lease-adjusted fleet capex was $326m — all of it operating leases — compared with earlier fleet spending typically in the $1.5-3bn range.
Because of the reduced capex, improved operating results and multiple refinancings, LATAM has been able to make headway in repairing its balance sheet. Free cash flow rose from $549m in 2016 to $1.4bn in 2017. Adjusted net debt/EBITDAR declined from 5.3x to 4.5x. Adjusted net debt fell from $11.1bn to $10.3bn. Liquidity remained healthy at $2.1bn (20.3% of LTM revenues).
The refinancings improved LATAM’s debt profile, extending maturities and reducing the average cost of debt. LATAM was able to pay down or refinance some of its expensive TAM legacy bonds. It also took advantage of good market opportunities to issue new unsecured debt at very low interest rates.
Deleveraging remains a priority for the group and the target is to reduce the leverage ratio below 4x by 2019. However, the management commented recently that regaining investment-grade credit ratings was no longer considered imperative. LATAM had lost LAN’s long-held investment-grade credit ratings immediately after the merger, essentially because of TAM’ high debt levels.
LATAM’s fleet commitments remain modest — $714m in 2018 and $1.2bn in 2019. Under the current plan, the next two years will see almost twice as many new deliveries as returns. The operating fleet is slated to grow from last year’s 307 to 316 at year-end 2018 and 322 at year-end 2019. It will be mainly narrowbody growth: more A320neos and (from this year) A321neos. On the widebody side, LATAM is taking more A350-900s and two more 787-9s, while reducing 767-300 numbers.
Prospects
LATAM expects to achieve an operating margin in the 7.5% to 9.5% range this year, up from last year’s 7%. It expects the demand environment to continue improving, so it is stepping up system capacity growth from 1% in 2017 to 5-7% in 2018. Domestic Brazil ASKs are projected to grow by 2-4%.
To take advantage of the rebound in cargo, LATAM has potentially two additional 767-300Fs available in 2018 (one returning from a sublease and one converted from a passenger aircraft). However, LATAM’s strategy has not changed in that the main focus is on filling bellyhold capacity. Cargo ATKs are projected to increase by a very modest 1-3% in 2018.
The guidance reflects expectations of continued economic recovery. Like Gol, LATAM is bullish on Brazil’s outlook. The IMF is currently forecasting Brazil’s GDP growth to accelerate to 1.9% in 2018 and 2.1% in 2019. The Latin America/Caribbean region is projected to see 1.9% and 2.6% growth in those years.
But there are challenges and risks. In February Fitch downgraded Brazil’s credit ratings in part because of lack of progress in legislating reforms. Upcoming elections in 2018 in Brazil, Colombia and Mexico create political uncertainty.
Longer term, there is much untapped potential for demand growth in Latin America, boosted by surging disposable incomes and swelling ranks of middle classes.
LATAM is now leaner and more efficient, benefits from a unique market position and has promising new strategies. Yet, its profit margins remain lower than those of its Latin American peers. Gol and Azul, for example, are guiding operating margins of 13% and 11-13%, respectively, in 2018.
Some analysts think that the lagging margins reflect the growing competition from LCCs in LATAM’s markets. First, there are the new entrants in the Spanish speaking countries. Viva Air Peru started operations in May 2017 as Peru’s first LCC. Indigo Partners-backed JetSmart launched in July 2017 in Chile. Flybondi took to the air in January 2018 as Argentina’s first ULCC, and Norwegian Air Argentina will follow suit this summer. Viva Air is reportedly looking at setting up its next unit in Ecuador. And those are just the most prominent of the numerous new or prospective LCC entrants.
LATAM believes that it is well-positioned to compete with LCCs in Chile because of its dominant market position, connectivity and leading FFP. Chile and Peru are “strategic markets” where LATAM is determined to keep its leadership position. But how will it affect profit margins?
Second, while there are no ULCCs in Brazil, there are signs of LATAM being outmanoeuvred by the nimbler established LCCs. Gol has improved its product and has consistently gained corporate market share.
Third, with the imminent implementation of US-Brazil open skies and the likely abolition of foreign ownership restrictions in Brazilian airlines, LATAM can expect much more competition on international routes and possibly even new Brazil-based LCCs.
In March Brazil’s Congress approved a fast track for a bill that would abolish the current 20% foreign ownership limit on the voting stock of airlines. If the bill passes, Delta could increase its stake in Gol and the smaller carriers could tap their foreign minority owners for extra funds.
It could also be an opportunity for the Brazilian Amaro family to fully divest their stake in LATAM (currently 5% of total shares and 80% of LATAM Brazil’s voting shares). Analysts have welcomed the Chilean Cueto family’s moves to increase their control because they represent the old highly-regarded LAN management team.
Foreign airlines such as Norwegian, Virgin and AirAsia have reportedly approached the Brazilian government to discuss potential investments in Brazil. But Brazil has high barriers to LCC entry (high costs, lack of slots at desirable airports, etc) and is already highly competitive. Norwegian, though, is on course to fly to Brazil from Argentina and London.
It is not surprising that opinion is divided on LATAM’s shares. In mid-March analysts’ recommendations for the NYSE-listed ADRs included six buys, six neutrals and three underperforms. Bradesco analysts cited three reasons for their neutral rating on LATAM: potential to continue losing premium and corporate market share; growing competition from LCCs and ULCCs; and an unattractive valuation. However, Bradesco did raise their year-end price target by 23% because of the positive outlook for LATAM in 2018, reflecting strong international demand, improving profitability in Brazil and cargo business recovery.
| 2015 | 2016 | 2017 | 2018E | 2019E | |||
|---|---|---|---|---|---|---|---|
| Passenger aircraft | narrowbody | A319-100 | 50 | 48 | 46 | 46 | 46 |
| A320-200 | 154 | 146 | 126 | 119 | 114 | ||
| A320neo | 0 | 2 | 4 | 10 | 14 | ||
| A321-200 | 36 | 47 | 47 | 49 | 50 | ||
| A321neo | 0 | 0 | 0 | 2 | 5 | ||
| Total narrowbody | 240 | 243 | 223 | 226 | 229 | ||
| widebody | A330-200 | 10 | 0 | 0 | 0 | 0 | |
| 767-300 | 38 | 37 | 36 | 35 | 35 | ||
| A350-900 | 1 | 7 | 5 | 9 | 13 | ||
| 777-300ER | 10 | 10 | 10 | 8 | 5 | ||
| 787-8 | 10 | 10 | 10 | 10 | 10 | ||
| 787-9 | 7 | 12 | 14 | 14 | 16 | ||
| Total widebody | 76 | 76 | 75 | 76 | 79 | ||
| Cargo aircraft | 777-200F | 3 | 2 | 2 | 0 | 0 | |
| 767-300F | 8 | 8 | 8 | 10 | 10 | ||
| Total cargo | 11 | 10 | 10 | 10 | 10 | ||
| TOTAL OPERATING FLEET | 327 | 329 | 308 | 312 | 318 | ||
| Aircraft leased out | A320-200 | 0 | 0 | 5 | 5 | 5 | |
| A350-900 | 0 | 0 | 2 | 0 | 0 | ||
| 777-200F | 1 | 0 | 0 | 0 | 0 | ||
| 767-300F | 3 | 3 | 1 | 0 | 0 | ||
| Total subleases | 4 | 3 | 8 | 5 | 5 | ||
| TOTAL FLEET | 331 | 332 | 316 | 317 | 323 | ||
Source: LATAM Airlines Group
Source: Company reports and Bradesco BBI.
Notes: Forecasts by Bradesco BBI (14 March 2018). 2011 and 2012 are pro forma figures (LAN and TAM merged in June 2012).
Note: Forecasts by Bradesco BBI (14 March 2018)
Note: * After several revisions in 2015-2017.
Source: Company reports
Notes: 2018: Mid-points of LATAM's forecast ranges. †SSC = Spanish speaking countries (Chile, Peru, Argentina, Colombia, Ecuador). Source: Company reports